Looking to enhance your website's engagement and capture valuable leads in…
Key Takeaways
- More often than not, key decision-makers are forced to make decisions without the supporting customer data science.
- The customer journey spans multiple platforms and it is critical that all sources are considered and accurately attributed to make better decisions.
- Creating a solid customer data science framework allows companies to begin developing a data analytics strategy with greater returns on their investments.
A recent survey by McKinsey found that only 20% of respondents say their organizations excel at decision-making. And a majority say a significant percentage of the time spent on decision-making is ineffective.
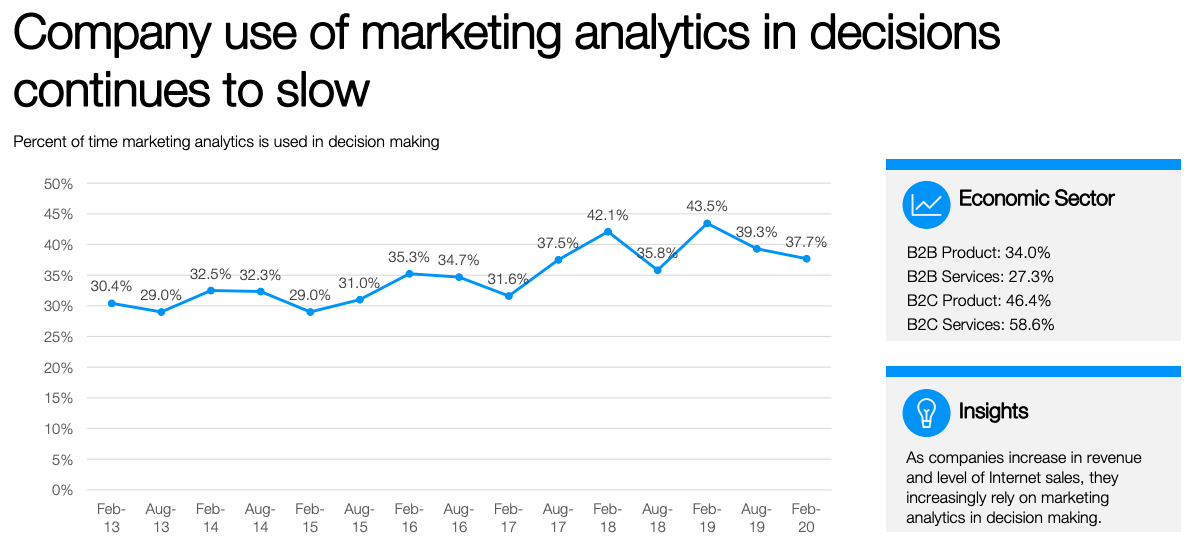
This blind spot extends from the boardroom to the marketing department, according to a CMO survey released in February of 2020. That survey of chief marketing officers found that CMOs use marketing analytics less than 40% of the time to make decisions.

How are these results possible when there is more customer data science available than ever before for leaders to make decisions? For example, most CMOs should have access to some, if not all, of the following data sources: web analytics, CRM, email marketing, social platforms, paid search, paid social, events, webinars, e-commerce and financial systems.
Our hunch is this blind spot results from the inability of most companies to collect, aggregate, standardize and attribute their customer data pipelines. For example, a typical customer journey might go something like this:
- User comes to the company’s site via organic search.
- The user is retargeted on a paid channel.
- The user then signs up for a newsletter.
- On a subsequent newsletter send, the user clicks on an article to get back to the company website.
- The user attends a webinar.
- From there the user becomes a lead and a salesperson reaches out.
- During the resulting opportunity the user receives product emails, views social posts and visits the website.
- Finally the customer signs a contract to purchase services from the company.
In fact, a recent study by Google found that depending on the product it can take anywhere from a handful to several hundred customer touch points to make a sale.
While all of this data is collected in each system — in this case, data attributes would be collected in the CRM, marketing automation, web analytics, webinar, Adwords, social platform and internal company databases — it is very difficult to track a journey across systems. Without a centralized system like a customer data platform, most marketers are only going to see a partial picture of the customer. In addition, each platform will have different attribution models, leading users to misstate data depending on how it is characterized. For example, an e-commerce company using a platform like Google Analytics will track purchases under the channel by last click data — meaning only the last click that led to the session will get credit for the sale. However, if you use the attribution on Google Adwords or Facebook they will give credit for both direct and indirect activities.
For example, Brad is interested in buying a widget from company X. He searches for the widget and clicks on an ad by company X. He wants to do some more research, so he doesn’t buy during that visit. In the meantime, a Facebook ad appeared in his feed through retargeting, but Brad doesn’t click it. A few days later he types in company X’s URL directly and makes the purchase. In Google Analytics, it will show his purchase in the “direct” channel. Google Adwords will give the ad platform credit for the sale, while Facebook shows that its platform deserves credit for the sale. At the end of the day it was one sale, so how does the company apportion the sale? This illustrates why it is sometimes challenging for marketing leaders to rely on the data available to them.
So what are marketers to do if they (correctly) believe that data should be used to make decisions about where to invest advertising and manpower resources?
A successful analytics strategy starts at the data layer. All activities must be tracked at the event level and categorized in a standard way in a centralized system. This means using a tagging system to get client-level data, such as clicks, or get server-level data, like transactions. Those activities should then be cleaned and tied back to a unique ID that builds a master customer record for each person and for each account where those relevant activities can be assessed.
Those datasets can then be evaluated by machine learning and AI to use data science to glean insight on a macro level and begin storytelling with data. For example, the combination of certain activities may create more qualified sales leads or perhaps customers are falling off at a specific point in the journey due to the wrong messaging or a bad user flow.
Based on the data attributes, consumers can be bucketed into specific persona groups using demographic and engagement data. A use case might be someone who abandoned an online cart getting an abandoned cart email with a coupon to help facilitate the purchase. Or based on activity, a user might get content served to them to overcome a barrier to purchase that has been identified in the marketing channel (email, web, paid, social, etc.) that best reflects the customer’s medium of choice.
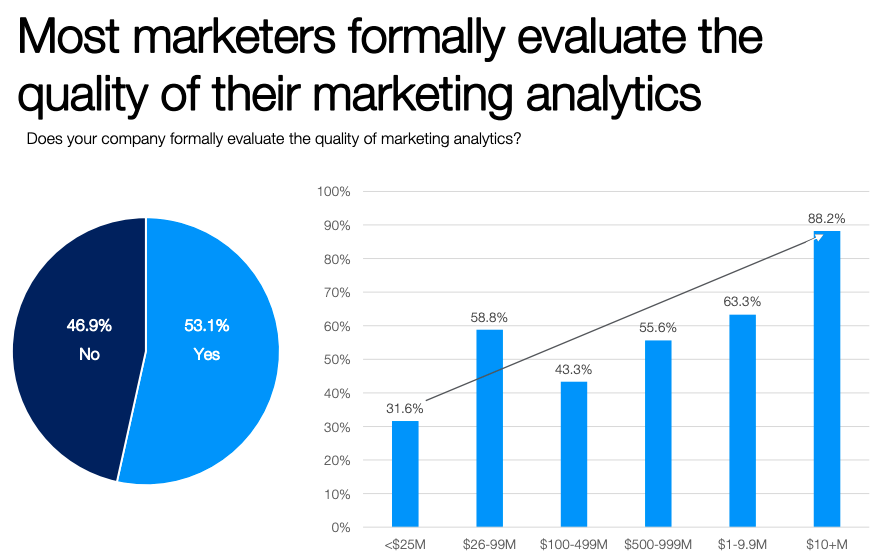
Companies must also validate their data pipeline to ensure its accuracy and that users are communicating the right insights in a correct manner. This includes validating when new datasets are introduced or updated to control against data corruption. The February 2020 CMO Survey also found that just over half of organizations validate their data, with many small or midsize companies validating data at a much lower rate.

Last, by putting a business intelligence dashboard on top of this data a marketing team can manage activities at the campaign level and at the persona level. This allows marketers to optimize resources by seeing which campaigns are working and which aren’t, allowing them to reduce spend, maximize messages and adjust designs to increase conversions and ROI, boosting their revenue performance management.
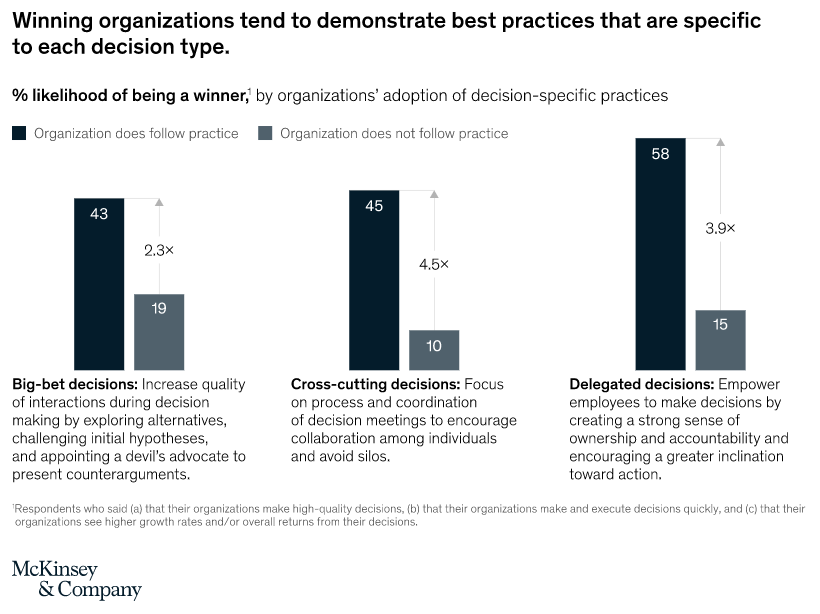
According to the earlier McKinsey study there are three types of decisions made in organizations — big-bet decisions (important strategic decisions), cross-cutting decisions (decisions that involve coordination across units) and delegated decisions (decisions made by employees involving local accountability and ownership). McKinsey found that winning organizations, defined as those in the 20% of companies reporting that they excel at decision-making, see their return on their investment increase by a factor of 2.3x to 4.5x as compared to their less-confident peers, depending on the type of decision.

We’ve found that confidence that comes with better decisions is always rooted in an organization’ data and how the data is visualized to decision-makers. By following the steps outlined above any company can more confidently navigate its business challenges.
The good news is that we know how to partner with organizations that understand the value of developing a data analytics strategy. Zirous is here to help you every step of the way. We speak the language of business and technology to create customer-centric organizations. Contact us today to learn more.


This Post Has 0 Comments